Can America Afford $40 Trillion in Debt? What Investors Need to Know
By The Intelligence Edge Research Team · June 16, 2026 · 24 min read
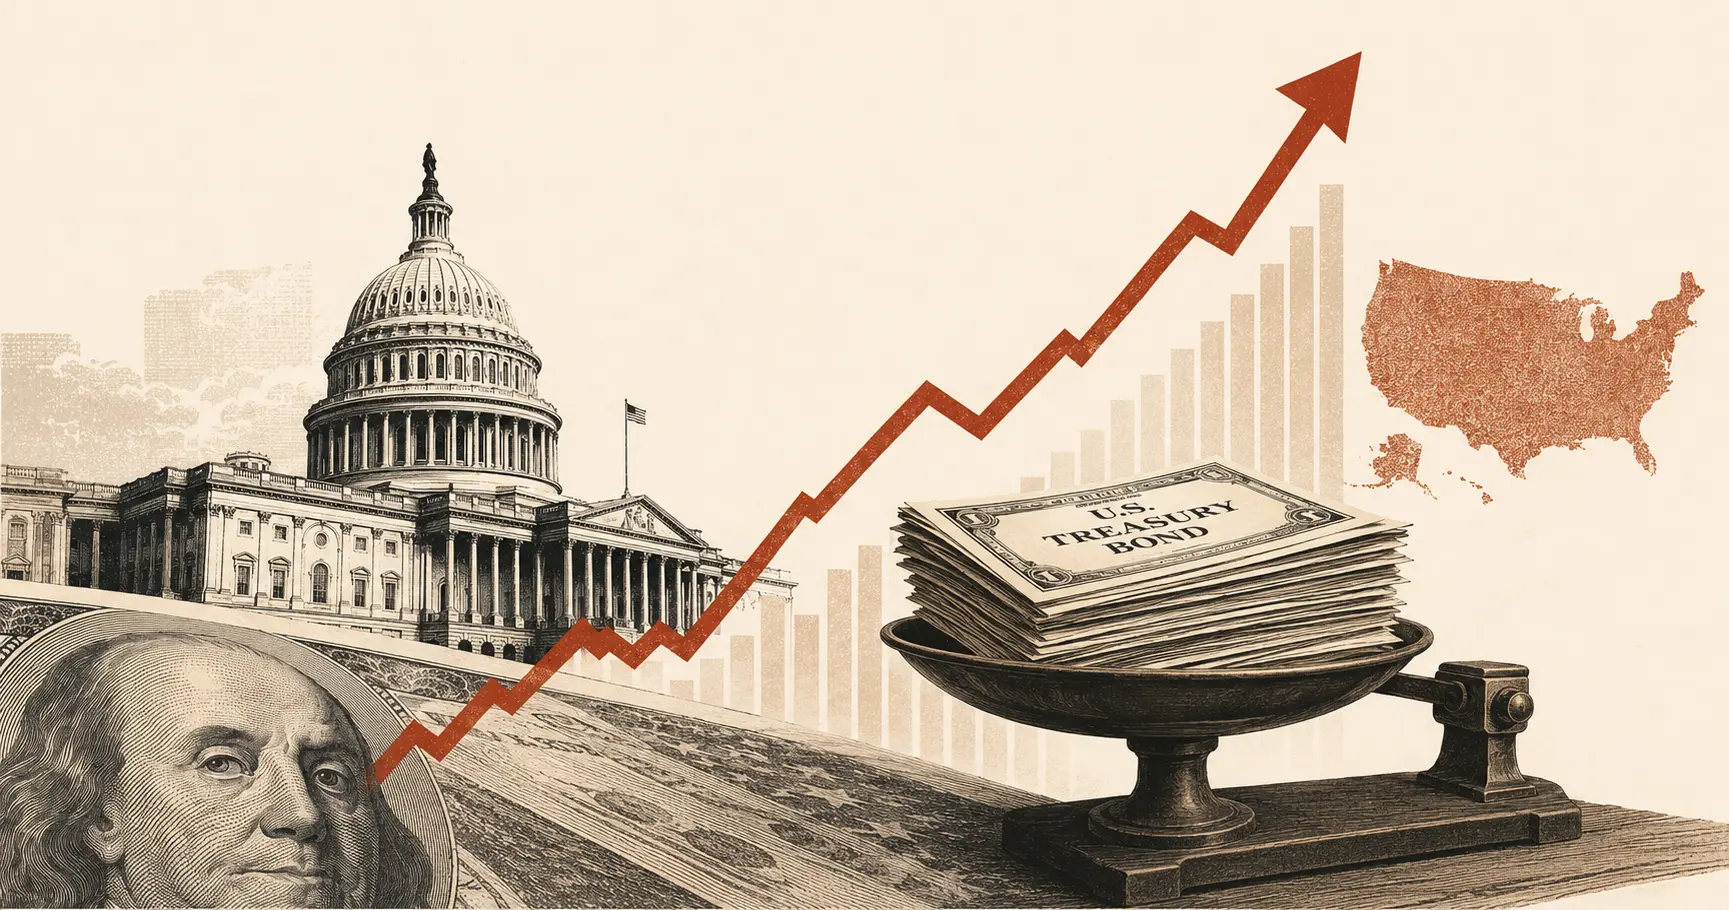
US national debt has now crossed $39 trillion. We unpack who really owns it, if America can go bankrupt, and what to watch next.
US national debt has crossed $39 trillion. Here's how it got here, who actually holds it, and the three scenarios investors should be watching for.
- US national debt crossed $39.2 trillion in June 2026, with debt-to-GDP near 123% — the highest sustained level in US history outside the brief 2020 pandemic spike.
- Interest payments alone now cost close to $1 trillion a year — more than the entire defense budget — and the CBO projects this doubles to $2.1 trillion by 2036.
- We believe the honest answer to the headline question is yes, for now. The US borrows in its own currency and remains the issuer of the world's reserve currency — but the trajectory, not the current level, is what deserves attention.
- We lay out three scenarios for the next decade, and the specific signals — Treasury auction demand, credit rating actions, net interest as a share of the federal budget — that would tell us which one is unfolding.
- Debt-to-GDP ratio
- Total debt compared to the size of the entire economy in a year. Like comparing your loan balance to your annual salary — it tells you whether the debt is large relative to what you earn, not just whether the number itself is big.
- Crowding out
- When interest payments eat up a growing share of the budget, leaving less room for everything else — similar to a household where a rising credit card minimum payment eats into money that used to go toward groceries or savings.
- Bid-to-cover ratio
- How many buyers showed up for every Treasury bond on offer. A ratio of 2.5 means there were 2.5 buyers bidding for every bond sold — like a house auction with several bidders per house. Above 2 is considered healthy demand.
- Treasury yield
- The interest rate the US government pays to borrow money for a set period (e.g., 10 years). It moves the other way to bond prices, and it's the benchmark that mortgage rates and many other loans are priced off of.
- Term premium
- The extra interest investors demand for lending money for longer. The same idea as a bank paying a higher rate on a 5-year fixed deposit than a 1-year one — longer commitment, higher compensation for the risk.
- Fiscal dominance
- A situation where debt payments become so large that they start dictating government decisions, rather than decisions being made freely. In effect, the bill starts driving the budget instead of the other way around.
Can America Afford This? Our Direct Answer
We believe the United States can comfortably service $39 trillion in debt today. The federal government has not missed a payment, Treasury auctions continue to clear without difficulty, and the dollar remains the dominant currency for global trade and reserves. In that narrow sense, the alarmist framing — "America is broke" — is wrong, and we think investors who trade on that framing alone are mispricing the present.
But we also think the comfortable framing — "debt doesn't matter for a country that prints its own currency" — is incomplete, and increasingly so. The arithmetic that matters isn't the $39 trillion headline number. It's the rate of change: how fast the debt is growing, how much it costs to service, and how that cost compares to everything else the government needs to fund. On those measures, the trend has shifted meaningfully over the past five years, and we analysed the data behind that shift below.
Our view, stated plainly: the United States is not in a debt crisis. It is in a slow-burning fiscal squeeze — one that is most visible not in the size of the debt itself, but in what the interest on that debt is starting to crowd out. That distinction matters for how investors should think about Treasury yields, the dollar, and fiscal policy risk over the next decade.
1. How America Got to $40 Trillion
The number itself can feel abstract, so we think it's worth tracing how the US arrived here — because the shape of the curve tells you more than the level.
For most of the postwar period, US federal debt was a manageable fraction of the economy — in the 1970s and early 1980s, debt held by the public sat well below 40% of GDP. From there, three distinct waves of borrowing reshaped the trajectory: the 1980s–2000s buildup driven by tax cuts, defense spending and recessions; the 2008 financial crisis, whose bank rescues, stimulus, and lost tax revenue roughly doubled the debt-to-GDP ratio over the following decade; and COVID-19, which produced the sharpest single jump in US fiscal history, pushing debt-to-GDP to roughly 133% in mid-2020 — a level not seen since the years immediately following World War II.
As of June 10, 2026, total public debt outstanding stood at $39.213 trillion — split between $31.592 trillion held by the public and $7.621 trillion in intragovernmental holdings. The debt-to-GDP ratio has settled at roughly 123%, and CBO's baseline has debt held by the public rising from 101% of GDP this year toward 120% by 2036.
A debt-to-GDP ratio of 123% means the government owes more than the entire country produces in a year — similar to a household owing $123,000 against a $100,000 annual income. That sounds alarming in isolation, but just like a mortgage, what matters more than the size of the loan is whether the interest rate is manageable and whether income (or in this case, GDP) keeps growing alongside it. We unpack exactly that trade-off in the next section.
The pace of accumulation is itself notable: over the twelve months to early March 2026, gross debt rose by $2.64 trillion — an average of roughly $7.2 billion per day. We think the key takeaway from this history isn't any single number — it's that each crisis ratchets the baseline higher, and the baseline has never meaningfully come back down. That pattern is the backdrop for everything that follows.
2. Interest Expense: The Real Problem
If there is one section of this article we'd ask investors to read carefully, it's this one. We believe the size of the debt is less important than what it now costs — and that cost has crossed a threshold that changes the conversation.
CBO's February 2026 baseline puts net interest costs at approximately $1.0 trillion in FY2026 — equivalent to 3.3% of GDP. That figure now exceeds the entire projected defense budget ($885 billion) and the entire Medicaid budget ($708 billion) for the same fiscal year. Interest on the debt is no longer a footnote — it is one of the largest line items in the federal budget, and it is growing faster than any other major category.
Why this is happening — and why it's structural, not cyclical
Two forces are compounding. First, the debt itself keeps growing as the government runs deficits — CBO projects a $1.9 trillion deficit in FY2026, equal to roughly 5.8% of GDP. Second, the cost of that debt has risen sharply. The average interest rate on the total marketable national debt was 3.355% as of February 2026 — up from just 1.512% five years earlier. As older, low-rate debt issued during 2020–2021 matures and gets refinanced at today's higher rates (the 10-year Treasury yield has traded around 4.4%–4.5% through June 2026), the average cost of the entire debt stock rises — even if the deficit itself stayed flat.
Where this goes if nothing changes
CBO's projections show net interest costs roughly doubling from $1.0 trillion in FY2026 to $2.1 trillion by FY2036 — rising from about 14% of total federal spending today to nearly 19% by 2036, and from 3.3% of GDP to 4.6% of GDP. Extended further, interest spending is projected to reach 6.9% of GDP by 2056 — at which point interest payments would exceed all defense spending and all discretionary spending combined, every year, indefinitely.
It does not mean the government "can't pay." It means that every dollar spent servicing existing debt is a dollar that isn't available for anything else.
Economists call this crowding out. Picture a household where the minimum payment on a credit card keeps climbing every year. The family's income hasn't dropped — but more and more of each paycheck has to go toward that minimum payment, leaving less for groceries, school fees, or savings. The government is in the same position: it isn't broke, but a bigger slice of every tax dollar collected is going straight to interest, leaving less room for defense, healthcare, or tax cuts — without borrowing even more.
We believe this crowding-out dynamic is the single most important fiscal trend for investors to track over the next decade, because it shapes the political incentives around tax policy, deficit reduction, and — most relevant to markets — how much new debt the Treasury needs to issue, and at what yield it can clear.
3. Who Owns America's Debt
This is the section we think is most misunderstood — and most likely to surprise readers who've absorbed the "China owns America" narrative.
Of the $39.2 trillion total, 80% ($31.6 trillion) is "debt held by the public" — the economically meaningful measure. The remaining 20% ($7.6 trillion) is intragovernmental debt — money the government owes its own trust funds, primarily Social Security and Medicare.
Within debt held by the public, domestic holders dominate. The Federal Reserve is the single largest holder of US debt overall, at approximately $4.9 trillion, built up through successive rounds of quantitative easing. Beyond the Fed, roughly 70% of publicly held debt is owned domestically — by mutual funds, pension funds, insurance companies, banks, and state and local governments.
Foreign entities hold roughly $9.4–9.5 trillion — about 24% of total debt. Japan is the largest foreign holder at roughly $1.1–1.2 trillion, having held that position since overtaking China in 2019. The United Kingdom is second at roughly $780–900 billion — much of it private financial-sector holdings routed through London. China's holdings have been steadily declining for over a decade, from a 2013 peak of roughly $1.3 trillion to approximately $650–760 billion today — around 2.4% of publicly held US debt.
We think the practical implication is this: the popular framing that foreign governments — particularly China — hold meaningful leverage over US fiscal policy through Treasury holdings is, on the current numbers, overstated. The far larger exposure sits with the Federal Reserve and with US-based pension funds, mutual funds, and insurers — meaning a disorderly Treasury market would be primarily a domestic financial stability event before it became a geopolitical one.
4. Can the US Actually Go Bankrupt?
This is the question that generates the most heat and the least precision in public debate, so we want to be careful with our language.
A sovereign currency issuer is not a household. A household that borrows must eventually repay principal from income, or it defaults. The US government borrows in its own currency and can — and routinely does — roll over maturing debt indefinitely by issuing new debt to replace it. It has never needed to "pay down" the national debt to zero, and there is no economic requirement that it ever should. As far as it goes, we agree with this argument.
But "can't default in the technical sense" is not the same as "no consequences." We see three distinct risk channels:
The dollar's reserve-currency status is a privilege, not a guarantee
Because the dollar is the world's primary reserve and trade-settlement currency, global demand for Treasuries provides a persistent buyer base most countries don't have. This is the core reason the US can run deficits that would be unthinkable for other nations. But this privilege has historically been earned through perceived fiscal and institutional stability — and we believe it can erode gradually rather than disappear suddenly.
Almost every country and major company on Earth holds US dollars and US government bonds as their "safe" savings — the way a family might keep an emergency fund in the most trusted bank they know. That trust is what lets America borrow so cheaply and so much. It isn't written into law anywhere; it exists only as long as the rest of the world keeps believing the US is the safest place to park money. A slow erosion of that trust — not a single dramatic event — is the real risk to watch.
Credit rating actions are a real signal of that erosion
In May 2025, Moody's downgraded the US sovereign credit rating from AAA to Aa1 — the first downgrade by Moody's since 1917 — following S&P's earlier downgrade to AA+. Neither triggered a crisis; demand at auctions held up. But we read these downgrades as data points in a trend, not isolated events — rating agencies explicitly cited long-term fiscal sustainability concerns, precisely the interest-expense trajectory detailed above.
The international comparison is more nuanced than it looks
Japan's government debt-to-GDP ratio sits at roughly 230–237% — nearly double the US figure — and Japan has sustained this for over two decades without a crisis. This is often used to argue the US has enormous headroom. We think this comparison is only partially useful. Japan's debt is overwhelmingly held domestically, Japanese households are large net savers, and — until very recently — Japanese interest rates were near zero. Even so, 2026 has seen Japanese government bond yields surge to multi-decade highs on spending concerns — a live illustration that even a debt structure considered "safer" than America's is not immune to repricing once rates normalize. The lesson we take from Japan isn't "the US has room to spare" — it's that debt-to-GDP alone is a poor predictor of when markets reprice sovereign risk, and the transition can happen faster than the accumulation that preceded it.
Our synthesis
We do not believe a conventional US default is a meaningful near-term risk, and we think investors positioning for one are fighting the wrong battle. The more realistic risk is what some economists call fiscal dominance: a state where debt service costs become large enough to constrain policy choices, where higher Treasury issuance pressures yields independent of Fed policy, and where the "risk-free rate" embeds a small but rising fiscal risk premium. That is a gradual repricing, not a default — but it shows up first in Treasury yields, then the dollar, then equity valuations through the discount rate. We think this is already partially underway.
Fiscal dominance simply means the bill starts driving the budget, instead of the budget driving the bill. Imagine a person whose credit card debt has grown so large that every financial decision — which job to take, whether to move cities, whether to have another child — gets filtered through "but what does this do to my monthly payment?" That's the position the US government risks drifting toward: tax and spending choices increasingly shaped by what keeps interest costs manageable, rather than by what's otherwise the best policy. And the risk premium mentioned above is just the small "trust tax" investors quietly start charging — a slightly higher interest rate demanded for lending to a borrower whose finances look a bit shakier than they used to, even if nothing has technically gone wrong yet.
5. Three Scenarios for the Next Decade
We want to commit to calibrated views, not hedge everything into vagueness. Each scenario below carries a probability band (likely = 55–80%, roughly even chance = 45–55%, unlikely = 20–45%, very unlikely = 5–20%) and a confidence level: 🟢 high confidence (multiple corroborating sources, few load-bearing assumptions) or 🟡 moderate confidence (reasonable evidence, but leaning on at least one unverified assumption).
Think of the percentage as our honest best guess at the odds, like a weather forecaster saying "70% chance of rain" — it's not a certainty, but it tells you how to plan. The 🟢/🟡 marker is a separate signal: it tells you how solid the evidence behind that guess actually is. A 🟢 means we're standing on firm ground (several independent data sources point the same way); a 🟡 means we believe it, but it leans on at least one assumption that hasn't been tested yet. We use both together so you know not just what we think, but how much weight to put on it.
Debt-to-GDP continues climbing along roughly the CBO baseline path — toward 108% by 2030 and 120% by 2036 for debt held by the public — without a discrete crisis event. Interest costs keep rising as a share of the budget, gradually crowding out discretionary spending and intensifying fights over the debt ceiling, entitlements, and tax policy. Treasury yields stay broadly near today's levels, perhaps drifting modestly higher as term premiums creep up. Further incremental credit downgrades or negative outlook revisions get absorbed by markets without major disruption.
We believe this is the path of least resistance: it requires no policy change, and the US political system has repeatedly shown a high tolerance for "manageable but expensive" outcomes over abrupt ones.
A combination of stronger-than-expected GDP growth (potentially AI-investment-driven productivity gains), higher-than-projected tariff revenue, and some bipartisan fiscal restraint causes the deficit to narrow meaningfully and debt-to-GDP to stabilize or even decline modestly. CBO's own recent projections already show higher tariff revenue reducing projected deficits by roughly $3.0 trillion over a ten-year window relative to earlier estimates — so this isn't a pure hypothetical, it's an extension of a trend already in the data.
We think this is genuinely possible but requires several things to go right simultaneously: sustained above-trend growth, tariff revenue that doesn't get offset by retaliatory effects elsewhere, and no major new spending commitments.
A weak Treasury auction — a sharp drop in the bid-to-cover ratio from current healthy levels (recently around 2.3–2.9 across maturities) — or a sudden move in long-dated yields triggers a broader repricing of US sovereign risk. This could be precipitated by a further credit downgrade landing badly, a foreign-holder reduction larger or faster than China's gradual pace, or a fiscal policy shock that pushes projected deficits meaningfully above current baselines. The result: higher borrowing costs feeding back into even higher interest expense — the "debt spiral" dynamic — forcing fiscal consolidation under market pressure rather than orderly policy choice.
A "weak auction" means fewer buyers show up wanting to lend the government money — like a house going up for sale and getting only one offer instead of several. When that happens, the seller (here, the US Treasury) has to offer a better deal — a higher interest rate — to attract buyers. But a higher rate means the next round of borrowing costs more, which makes the deficit bigger, which means even more borrowing is needed, at potentially even higher rates. That self-feeding loop is what economists mean by a "debt spiral" — not a single event, but a cycle that can become harder to stop once it starts.
We do not believe this is the most likely outcome over the next few years, and would push back on framing that treats it as imminent. But we believe the probability rises mechanically over time, simply because a larger, more expensive debt stock has less room to absorb a shock before the dynamics become self-reinforcing.
6. What Investors Should Watch
Rather than trying to time a crisis we believe is more likely to arrive gradually than suddenly, we think a short watchlist is more useful — each of which we plan to track in upcoming pieces in this series.
- Net interest as a share of federal outlays. Currently around 14% (FY2026), with CBO projecting ~19% by 2036. A sustained move materially above that glide path is the clearest signal Scenario 1 is deteriorating toward Scenario 3.
- Treasury auction demand — bid-to-cover ratios. Recent readings around 2.3–2.9 indicate healthy demand. A sustained drop below 2.0 on benchmark maturities would be an early warning.
- 10-year and 30-year Treasury yields. Currently around 4.4–4.5% and roughly 5.0% respectively. The level matters less than the reason for any sharp move.
- Foreign holder behavior via TIC data. Watch for acceleration in China's gradual reduction, or — more importantly — any change in Japan's position, given Japan's own fiscal pressures are intensifying in parallel.
- Credit rating actions and their market reception. Further downgrades are likely over time; what matters is whether markets continue absorbing them calmly or start reacting more sharply.
- The debt-to-GDP ratio itself, but as a trend, not a threshold. There's no magic number that triggers a crisis — the rate of change relative to GDP growth determines whether the situation is stabilizing or deteriorating.
This analysis draws on primary government and central-bank data as of June 2026: the US Treasury's Fiscal Data "Debt to the Penny" dataset, the Congressional Budget Office's February 2026 Budget and Economic Outlook and long-term projections, the Joint Economic Committee's Monthly Debt Update, Treasury International Capital (TIC) data, and Federal Reserve (FRED) data for Treasury yields. International comparison figures for Japan are drawn from Trading Economics and Bank of Japan reporting.
Projections beyond the 10-year window — particularly the 2056 figures cited in Section 2 — depend on current-law assumptions that are routinely revised as tax and spending legislation changes. Readers should treat anything beyond a 10-year horizon as illustrative of direction, not a precise forecast. This article is for educational and informational purposes only and is not investment advice; do your own due diligence and consult a qualified financial advisor before making investment decisions.