VOO vs SCHD: Growth or Income? The Passive Investing Debate
By The Intelligence Edge Research Team · July 12, 2026 · 18 min read
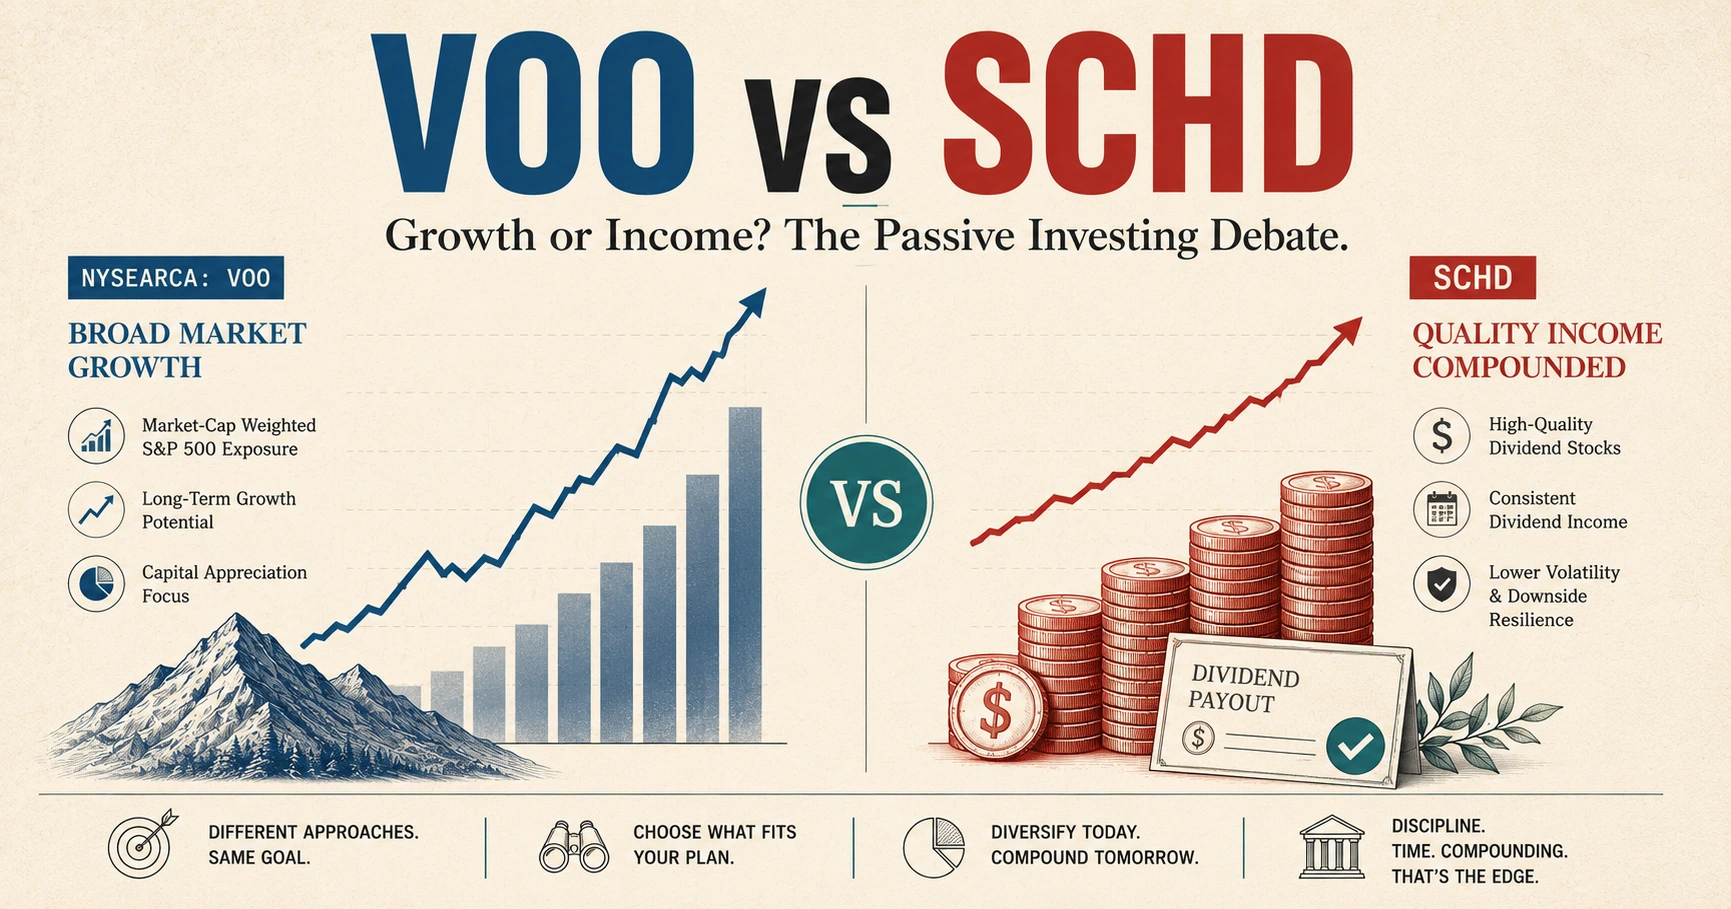
We rebuilt 14 years of VOO and SCHD returns from scratch: growth versus income, drawdowns, dividend growth, and the Magnificent-7 gap that divides them.
Two of the most-owned ETFs in America sit at opposite ends of one decision: own the market's winners, or own its payers. Over fourteen years the gap between them was not luck — it was design. We rebuilt the record from scratch to show exactly how each behaves, and why.
VOO and SCHD are not competitors to be ranked. They are two different tools built for two different jobs — and the right answer depends on which job you are hiring for.
The whole U.S. large-cap market at three basis points. Maximum long-run growth, but you accept a portfolio that is now one-third seven stocks, a sub-1.1% yield, and the deepest drawdowns of the two. The tool for accumulation and total return.
A rules-based screen for durable, growing dividends. You give up roughly two points a year of return for a 3.2% yield, faster-growing income, milder bear markets, and near-zero overlap with VOO's top names. The tool for income and ballast.
For a long-horizon accumulator, VOO's edge in compounding is real and hard to give up. For an investor who spends the dividends, values a smoother ride, or wants to dilute mega-cap concentration, SCHD earns its place — most often alongside VOO, not instead of it. The two share zero of their top-ten holdings, which is the whole argument for owning both.
Total-return figures elsewhere in this report include reinvested dividends; this live chart shows price only, so it will read a touch lower than the total-return numbers.
Executive Summary
Over the common fourteen-and-three-quarter-year window since SCHD's October 2011 launch, VOO returned 14.98% annualized versus SCHD's 13.02% — a two-point gap that turned a $10,000 stake into $78,382 against $60,797. VOO also won on risk-adjusted return, with a higher Sharpe (0.93 vs 0.83) and Sortino (1.50 vs 1.36).
But the averages conceal two funds that behave nothing alike in the years that test investors. In the 2022 rate shock SCHD fell just 3.3% while VOO dropped 18.2%; across the 2023–2025 artificial-intelligence rally VOO's mega-cap concentration flipped from liability to rocket fuel; and in 2026 to date the pattern has reversed hard, with SCHD up 20.1% against VOO's 11.3%. Underneath, the two funds are built from almost entirely different companies: VOO holds 34% of its assets in the Magnificent Seven, SCHD holds essentially none, and their top-ten lists share no names at all. SCHD's dividend has compounded at 11.0% a year to VOO's 7.3%, leaving a founding-era SCHD holder earning 12.6% on original cost. The rest of this report shows, with original data, exactly how and why these differences arise — and which investor each fund actually suits.
Two Philosophies, Two Portfolios
Before the numbers: why each fund exists at all.
VOO exists to be the market. It tracks the S&P 500 by full replication, holds all 500-odd names in their market-cap proportions, charges 0.03%, and makes no judgment about which companies deserve your money — the market's collective bid decides. When you buy VOO you are buying American large-cap capitalism in bulk, and accepting whatever that index becomes. Today that means accepting a heavy tilt toward the companies the market has already crowned: the bigger a stock's market value, the bigger its weight, so success compounds into concentration automatically.
SCHD exists to do the opposite — to select. It tracks the Dow Jones U.S. Dividend 100, an index with a rulebook: a company must have paid dividends for at least ten consecutive years, then survive a composite screen ranking cash-flow-to-debt, return on equity, dividend yield, and five-year dividend growth. Only the hundred strongest survivors make the cut, weighted with caps to prevent any single name or sector from dominating. Where VOO asks "how big is it?", SCHD asks "how durable and growing is the dividend?" — and those two questions produce startlingly different portfolios.
Because SCHD's screen rewards yield and a long dividend record, it structurally excludes most of the high-growth mega-caps that dominate VOO — Nvidia, Amazon, Tesla, and (until recently) the rest pay little or no dividend, or lack the ten-year history. This is not an accident to be corrected; it is the design. SCHD is engineered to not look like the S&P 500.
Portfolio Construction: What You Actually Own
Same asset class, opposite blueprints.
Line the two funds up sector by sector and the philosophies become concrete. VOO pours a third of its weight into Information Technology; SCHD holds barely 9%. SCHD leans into the sectors that pay — Financials, Consumer Staples, Health Care, and Energy together make up two-thirds of the fund — while those same four sectors are a minority of VOO. Neither is diversified the way the other is.
The mirror image is the story: VOO's tower is technology, SCHD's are the dividend-paying staples, financials, health care, and energy. SCHD owns no utilities and almost no pure-growth technology.
The difference is not only sector labels but factor exposure — the underlying styles that drive returns. VOO, dominated by its largest holdings, tilts toward growth, momentum, and quality-at-any-price. SCHD is a value-and-quality fund by construction: its holdings trade at lower multiples, generate high returns on equity, and are filtered for balance-sheet strength. When "growth" leads the market, VOO's factors are in favor; when "value" or "quality" leads, SCHD's are. That single fact explains most of what the performance record is about to show.
The Fourteen-Year Record
What $10,000 became — and the very different rides it took to get there.
Both funds are young enough that their entire lives fit in one chart, and old enough for that chart to mean something. SCHD launched in October 2011; VOO a year earlier. To compare them fairly we start the clock at SCHD's inception and run it to July 2026 — 178 months, just under fifteen years, spanning the 2015–16 growth scare, the 2018 selloff, the COVID crash, the 2022 rate shock, and the 2023–25 artificial-intelligence rally.
Every figure in this section is total return — price change plus dividends reinvested — computed by TIER from adjusted daily closes, not copied from a fund marketing page. That lets us calculate things the fact sheets do not publish: rolling returns, drawdowns, downside-risk ratios, and the overlap between what these two funds actually hold.
One honest limit: because the funds themselves only exist from 2010–11, we cannot run them through the dot-com bust or the 2008 crisis. Where this report reaches into those older eras it uses the underlying indices as proxies, and says so.
VOO pulled ahead in the growth years and never gave the lead back — but notice how tightly the two lines tracked until 2022, then diverged as mega-cap technology took off.
The headline looks decisive: an extra 1.96 percentage points a year compounds into roughly $17,600 more per $10,000 over the period. But an annualized average hides the year-to-year reality, and the year-to-year reality is where these two funds stop looking alike.
The tale of two funds sits in three bars: 2022 (SCHD down 3%, VOO down 18%), the 2023–25 AI years (VOO's blue towers over SCHD), and 2026 so far, where the pattern violently reverses.
Three moments define the record. In 2022, when rising rates punished long-duration growth stocks, SCHD lost just 3.3% while VOO fell 18.2% — a fifteen-point cushion in a single bad year. Then in the 2023–2025 AI rally, the concentration that hurt VOO in 2022 became its engine: it returned 26%, 25%, and 18% while SCHD managed 5%, 12%, and 4%. And in 2026 to date, the wheel turns again — SCHD is up 20.1% against VOO's 11.3%, the sharpest value-over-growth rotation of the entire window.
- VOO won the total-return race, 14.98% to 13.02% annualized, and led on risk-adjusted return too.
- SCHD won the bad years. Its worst calendar loss in fourteen years was 5.6%; VOO's was 18.2%.
- The lead was built in bursts, not steadily — almost entirely in the growth-led stretches of 2019 and 2023–25.
- Leadership rotates. 2026 is already a live reminder that the last decade's winner is not guaranteed to be the next one's.
Original Research: The Numbers the Fact Sheets Skip
Drawdowns, downside risk, concentration, and income — measured, not asserted.
A total-return chart tells you who finished ahead. It does not tell you how much fear you had to stomach, how concentrated your bet really was, or how your income grew while you waited. Those are the questions that decide whether an investor actually keeps a fund through a bad year — so those are the questions we measured.
How deep was the pain?
Maximum drawdown — the worst peak-to-trough fall — is the number that shakes investors out at the bottom. The two funds took their worst hits in different crises, which is itself the point: they are not the same bet wearing different tickers.
SCHD's deepest hole was COVID (down 21.5%); VOO's was the 2022 rate shock (down 23.9%). But look at 2022 specifically — VOO plunges while SCHD barely dips.
Both funds share a high monthly-return correlation of 0.85 — they are, after all, both large-cap U.S. equity — yet they diverge exactly when it matters, in the drawdowns. Translating volatility into the ratios professionals actually use:
| Risk & return (Oct 2011 – Jul 2026) | VOO | SCHD |
|---|---|---|
| Annualized return (CAGR) | 14.98% | 13.02% |
| Annualized volatility | 13.94% | 13.50% |
| Maximum drawdown | −23.9% | −21.5% |
| Sharpe ratio (rf 2%) | 0.93 | 0.83 |
| Sortino ratio (rf 2%) | 1.50 | 1.36 |
| Worst 3-year annualized | 5.1% | 3.4% |
| Worst 5-year annualized | 6.7% | 5.9% |
Reading the ratios. Sharpe and Sortino both reward return per unit of risk; VOO edges SCHD on both because its extra return more than paid for its slightly higher volatility over this specific window. Note that SCHD's volatility was lower despite a similar drawdown, and its worst rolling stretches were close behind VOO's — a flatter ride for nearly the same floor.
How concentrated is the bet?
This is where the two funds are least alike, and where most comparisons go silent. We pulled both funds' current holdings and lined up their top ten. They do not share a single name.
More than a third of VOO — 34% — rides on seven correlated mega-cap stocks. SCHD's dividend-quality screen holds essentially none of them.
VOO now carries 34.3% of its assets in the Magnificent Seven — Nvidia (7.9%), Apple (7.0%), Microsoft, Amazon, Alphabet, Meta, and Tesla. SCHD holds none of them; its rulebook demands a decade of dividends and a quality screen those names fail on yield or track record. Its top ten instead runs through Chevron, ConocoPhillips, Merck, Verizon, and Coca-Cola — energy, staples, health care, telecom — each near 4%, with no single sector above roughly 19%.
Because VOO's and SCHD's top ten share no names at all, the two funds are almost entirely non-redundant at the concentrated top of each portfolio. That is the core argument for owning both rather than choosing: SCHD is not a watered-down S&P 500, it is a different portfolio that happens to be denominated in the same currency of U.S. large-cap stock.
How fast did the income grow?
Total return is only half of SCHD's case; the other half is the paycheck. SCHD yields about 3.2% today against VOO's 1.1% — but the more revealing number is growth. SCHD's dividend compounded at 11.0% a year from 2012 to 2025, half again as fast as VOO's 7.3%. For an investor who bought at the start and simply held, that faster growth stacks up into a striking gap in yield on original cost.
A founding-era SCHD holder now collects about 12.6% a year on what they paid — roughly double VOO's yield on cost, and the clearest single picture of the income case.
| Income profile | VOO | SCHD |
|---|---|---|
| Current trailing yield | 1.07% | 3.24% |
| Dividend CAGR 2012–2025 | 7.28% | 10.99% |
| Distribution per share, 2012 | $2.84 | $0.27 |
| Distribution per share, 2025 | $7.07 | $1.05 |
| Yield on cost, 2011 buyer | 6.36% | 12.57% |
Note. SCHD's per-share figures are on a post-split basis (a 3-for-1 split took effect October 2024); the growth rate and yield-on-cost are computed on a consistent split-adjusted series, so the split creates no artificial jump.
- Different crises, by design: SCHD's worst drawdown was COVID; VOO's was 2022. In 2022 itself SCHD fell a fraction as far.
- VOO is a concentrated bet — 34% in seven stocks — whether or not its owners think of it that way.
- Zero top-ten overlap makes the two funds genuine complements, not substitutes.
- SCHD's income compounds faster — ~11% dividend growth and a 12.6% yield on a founding-era cost basis.
Valuation: What You Pay for the Growth
The premium is real, and it is the whole trade-off.
The performance gap is not free. As of the March 2026 fact sheets, VOO trades at 26.1 times earnings and 4.8 times book, against SCHD's 18.3 times earnings and 3.7 times book. You pay roughly a 40% higher earnings multiple for VOO — and in exchange you get a portfolio the index measures as growing earnings at 23.5% versus SCHD's high-single-digit pace, at a nearly identical return on equity (29.0% vs 27.0%).
| Valuation & quality (Mar 31, 2026) | VOO | SCHD |
|---|---|---|
| Price / earnings | 26.1x | 18.3x |
| Price / book | 4.8x | 3.7x |
| Return on equity | 29.0% | 27.0% |
| Earnings growth rate | 23.5% | 9.1% |
| Trailing dividend yield | 1.07% | 3.24% |
| Number of holdings | 504 | 102 |
| Expense ratio | 0.03% | 0.06% |
How to read the premium. A higher multiple is not automatically "expensive" — it can be justified by faster growth. The question VOO's 26x asks is whether the mega-caps can keep growing earnings fast enough to grow into that price. SCHD's 18x asks far less of the future: its holdings are cheaper, and much of your return is handed back as a rising cash dividend rather than staked on continued multiple expansion. The valuation gap is the growth-versus-income trade in a single number.
This matters most at the extremes. If mega-cap earnings keep compounding, VOO's premium proves cheap in hindsight, as it did in 2023–25. If that growth disappoints, a 26x multiple has a long way to fall — and SCHD's lower starting valuation and cash yield become a cushion, as they did in 2022. Valuation does not tell you when, only how much is riding on the assumption.
Four Macro Scenarios
Which fund the weather favors — and why.
Because the two funds carry opposite factor exposures, most macro regimes help one at the other's expense. This is not a forecast of what will happen; it is a map of how each fund tends to respond when it does.
| If the macro regime is… | Tends to favor | Why |
|---|---|---|
| AI capex boom continues | VOO | Earnings accrue to the mega-cap platforms and chipmakers that dominate VOO and are absent from SCHD. |
| Growth slows / recession | SCHD | Staples, health care, and steady dividend payers are defensive; SCHD fell a fraction of VOO in 2022 and 2018. |
| Interest rates fall | Mixed, edge VOO | Lower rates lift long-duration growth multiples (VOO), but also make SCHD's 3%+ yield relatively less scarce. |
| Inflation resurges | SCHD | Energy, financials, and pricing-power staples — heavy in SCHD — historically weather inflation better; a rising dividend offsets some erosion of purchasing power. |
| Market broadens beyond mega-cap | SCHD | If leadership rotates from the top seven names to the other 493 — as in early 2026 — SCHD's spread portfolio captures it while VOO is anchored by its giants. |
The honest takeaway is that no single investor knows which regime is coming. That uncertainty is itself an argument for holding both: the pair is far more regime-agnostic than either fund alone, precisely because their winning conditions rarely overlap.
Which Investor Should Own Each
The same data points to different answers for different people.
There is no universal winner because there is no universal investor. Map the funds to the goal instead:
| Investor | Leans | Reasoning |
|---|---|---|
| Young accumulator (20s–30s) | VOO | Decades of horizon make total return king; the low yield is irrelevant when dividends are reinvested anyway, and volatility is time to buy cheaper. |
| Retiree drawing income | SCHD (or both) | A 3.2% growing dividend can fund spending without selling shares; the milder drawdowns reduce sequence-of-returns risk early in retirement. |
| FIRE / income-bridger | Both | VOO builds the number; SCHD converts it into a rising, low-maintenance paycheck once you stop working. |
| Concentration-averse indexer | Add SCHD to VOO | Pairing dilutes VOO's 34% mega-cap bet with a portfolio that shares none of those names. |
Where you hold each matters. SCHD's dividends are taxed as income in a taxable account, so it often fits best in a tax-sheltered account — a Roth IRA or 401(k) in the U.S., a TFSA or RRSP in Canada — where the growing income compounds untaxed. VOO's low yield and mostly-unrealized capital gains make it comparatively tax-efficient even in a taxable brokerage account. This is general education, not personal tax advice; rules vary by country and situation.
Estimate Your Own Outcome
A back-of-envelope projection — your inputs, your assumptions.
Load a fund to fill in its historical figures, then change any number to match your own view. The presets use each fund's historical total-return CAGR since 2011, its current yield, and its 2012–2025 dividend-growth rate. Those come from the past and are not forecasts — the most useful thing you can do here is dial the return down and check the plan still holds.
Illustrative estimate only — not a prediction, recommendation, or advice. It assumes a constant annual return and steady dividend growth; real markets are volatile and returns vary widely from year to year. Past performance does not guarantee future results. Contributions are added monthly; dividends are modeled annually.
Bull, Base, and Bear
Three futures for the next decade — estimative ranges, not predictions.
The past fourteen years were an unusually strong tailwind for U.S. large-cap equity; no one should annualize 15% into the future. What follows are TIER's illustrative scenarios for how the relationship between the two funds might evolve, with rough return ranges meant to frame thinking, not to be banked on.
| Scenario | VOO | SCHD | The world that produces it |
|---|---|---|---|
| Bull | 11–14%/yr | 9–12%/yr | AI-driven productivity keeps mega-cap earnings compounding; both rise, VOO leads. |
| Base | 6–9%/yr | 7–10%/yr | Growth normalizes and the market broadens; returns converge, SCHD's income closes much of the gap. |
| Bear | 0–4%/yr | 3–7%/yr | Mega-cap multiples compress toward history (a 2000–2010-style "lost decade" for the index); SCHD's lower valuation and cash yield outperform. |
The asymmetry worth noticing. In two of the three scenarios SCHD is competitive or ahead; VOO clearly wins only if mega-cap growth persists at an elevated pace. That is not a prediction that it won't — it has for over a decade — but it is the concentration risk stated plainly. VOO's future leans harder on a single assumption than SCHD's does.
- VOO is the growth engine — cheapest access to U.S. large-cap total return, if you can hold through 20%+ drawdowns and accept mega-cap concentration.
- SCHD is the income-and-ballast holding — lower returns, but a bigger, faster-growing dividend, milder bears, and a genuinely different portfolio.
- Zero top-ten overlap is why "both" is a coherent answer, not a hedge — the pair is more regime-proof than either alone.
- Match the tool to the job: accumulate with VOO, draw income with SCHD, and let your horizon and temperament set the mix.
Further Reading
- The concentration behind VOO: NVIDIA's China Exposure and How AI Electricity Demand Is Reshaping America's Utility Sector — the AI trade that drives VOO's largest holdings.
- Income & dividend investing: Best Canadian Energy Stocks for a TFSA — single-name dividend ideas next to SCHD's rules-based basket.
- The macro backdrop: The Three Risks We're Watching and Can America Afford $40 Trillion in Debt? — the AI-capex and interest-rate scenarios in fuller context.
Methodology & Sources
Every performance figure in this report is total return — price appreciation plus reinvested dividends — computed by TIER from daily adjusted closing prices over the common window of October 2011 (SCHD's inception) through July 2026, 178 monthly observations. Adjusted close accounts for both dividends and stock splits, including SCHD's 3-for-1 split of October 2024; we verified the split introduces no artificial discontinuity in the per-share dividend series.
Sharpe and Sortino ratios assume a flat 2.0% annual risk-free rate, a reasonable period average; the VOO-over-SCHD ordering on both ratios holds under any plausible alternative. Drawdowns are measured on month-end marks — true intra-month lows were modestly deeper (VOO reached roughly −25% intraday in 2022; SCHD roughly −33% at the COVID low). Holdings, sector weights, and valuation multiples are drawn from the funds' own fact sheets dated March 31, 2026. Because the funds themselves only date to 2010–11, this report does not run them through the 2000 or 2008 crises; any such comparison would require index proxies and is out of scope here.
- Vanguard. Vanguard S&P 500 ETF (VOO) fact sheet and prospectus; annual & semi-annual shareholder reports (SEC Form N-CSR).
- Charles Schwab. Schwab U.S. Dividend Equity ETF (SCHD) fact sheet and prospectus; Schwab Strategic Trust N-CSR filings.
- S&P Dow Jones Indices. S&P 500 and Dow Jones U.S. Dividend 100 index methodologies.
- Price & dividend data. Daily adjusted closes and distribution history via public market-data feeds; all derived statistics computed independently by TIER.
This report is independent research for educational purposes and is not investment, tax, or financial advice, nor a recommendation to buy or sell any security. Past performance does not guarantee future results. Figures are as of the dates stated and will change.
Frequently Asked Questions
Is VOO or SCHD better for 2026?
Neither is universally "better." VOO has delivered higher long-run total return (14.98% vs 13.02% annualized since 2011); SCHD offers a much higher, faster-growing dividend and falls less in downturns. Notably, in 2026 to date SCHD (+20.1%) has sharply outperformed VOO (+11.3%) as the market rotated away from mega-cap growth — a reminder that recent leadership can reverse quickly. The right choice depends on whether you want growth or income.
Can I just own both VOO and SCHD?
Yes, and it is a common approach. The two funds share zero of their top-ten holdings and carry opposite sector and factor tilts, so combining them dilutes VOO's 34% Magnificent-Seven concentration while adding a growing income stream. A blend is more regime-agnostic than either fund alone; the mix (for example, weighting more to VOO while young and shifting toward SCHD near retirement) is a personal decision.
Why does SCHD hold none of the Magnificent Seven?
SCHD tracks the Dow Jones U.S. Dividend 100, which requires ten consecutive years of dividends plus a quality-and-yield screen. Most mega-cap growth names pay little or no dividend, or lack the long record, so the rulebook excludes them by design. This is why SCHD looks nothing like the S&P 500.
Does SCHD's higher yield mean more total return?
No. Yield is income, not total return. Over this period VOO's lower yield was more than offset by faster price growth, giving it the higher total return. SCHD's case is not that it returns more — it usually returns somewhat less — but that it pays a larger, faster-growing, and more reliable cash dividend with milder drawdowns.
Which is more tax-efficient?
In a taxable account, VOO is generally more tax-efficient because most of its return is unrealized capital gains and its dividend is small. SCHD's larger dividend is taxed as income each year, so it often fits better in a tax-sheltered account (Roth IRA, 401(k), TFSA, or RRSP). Tax rules vary by country and situation; consult a professional for your own case.